Monitoring Projects
View Tracking
To view tracking metrics:
- Navigate to Projects.
- Click the project you would like to monitor.
You’ll be directed to the project’s Performance page.
Details Breakdown
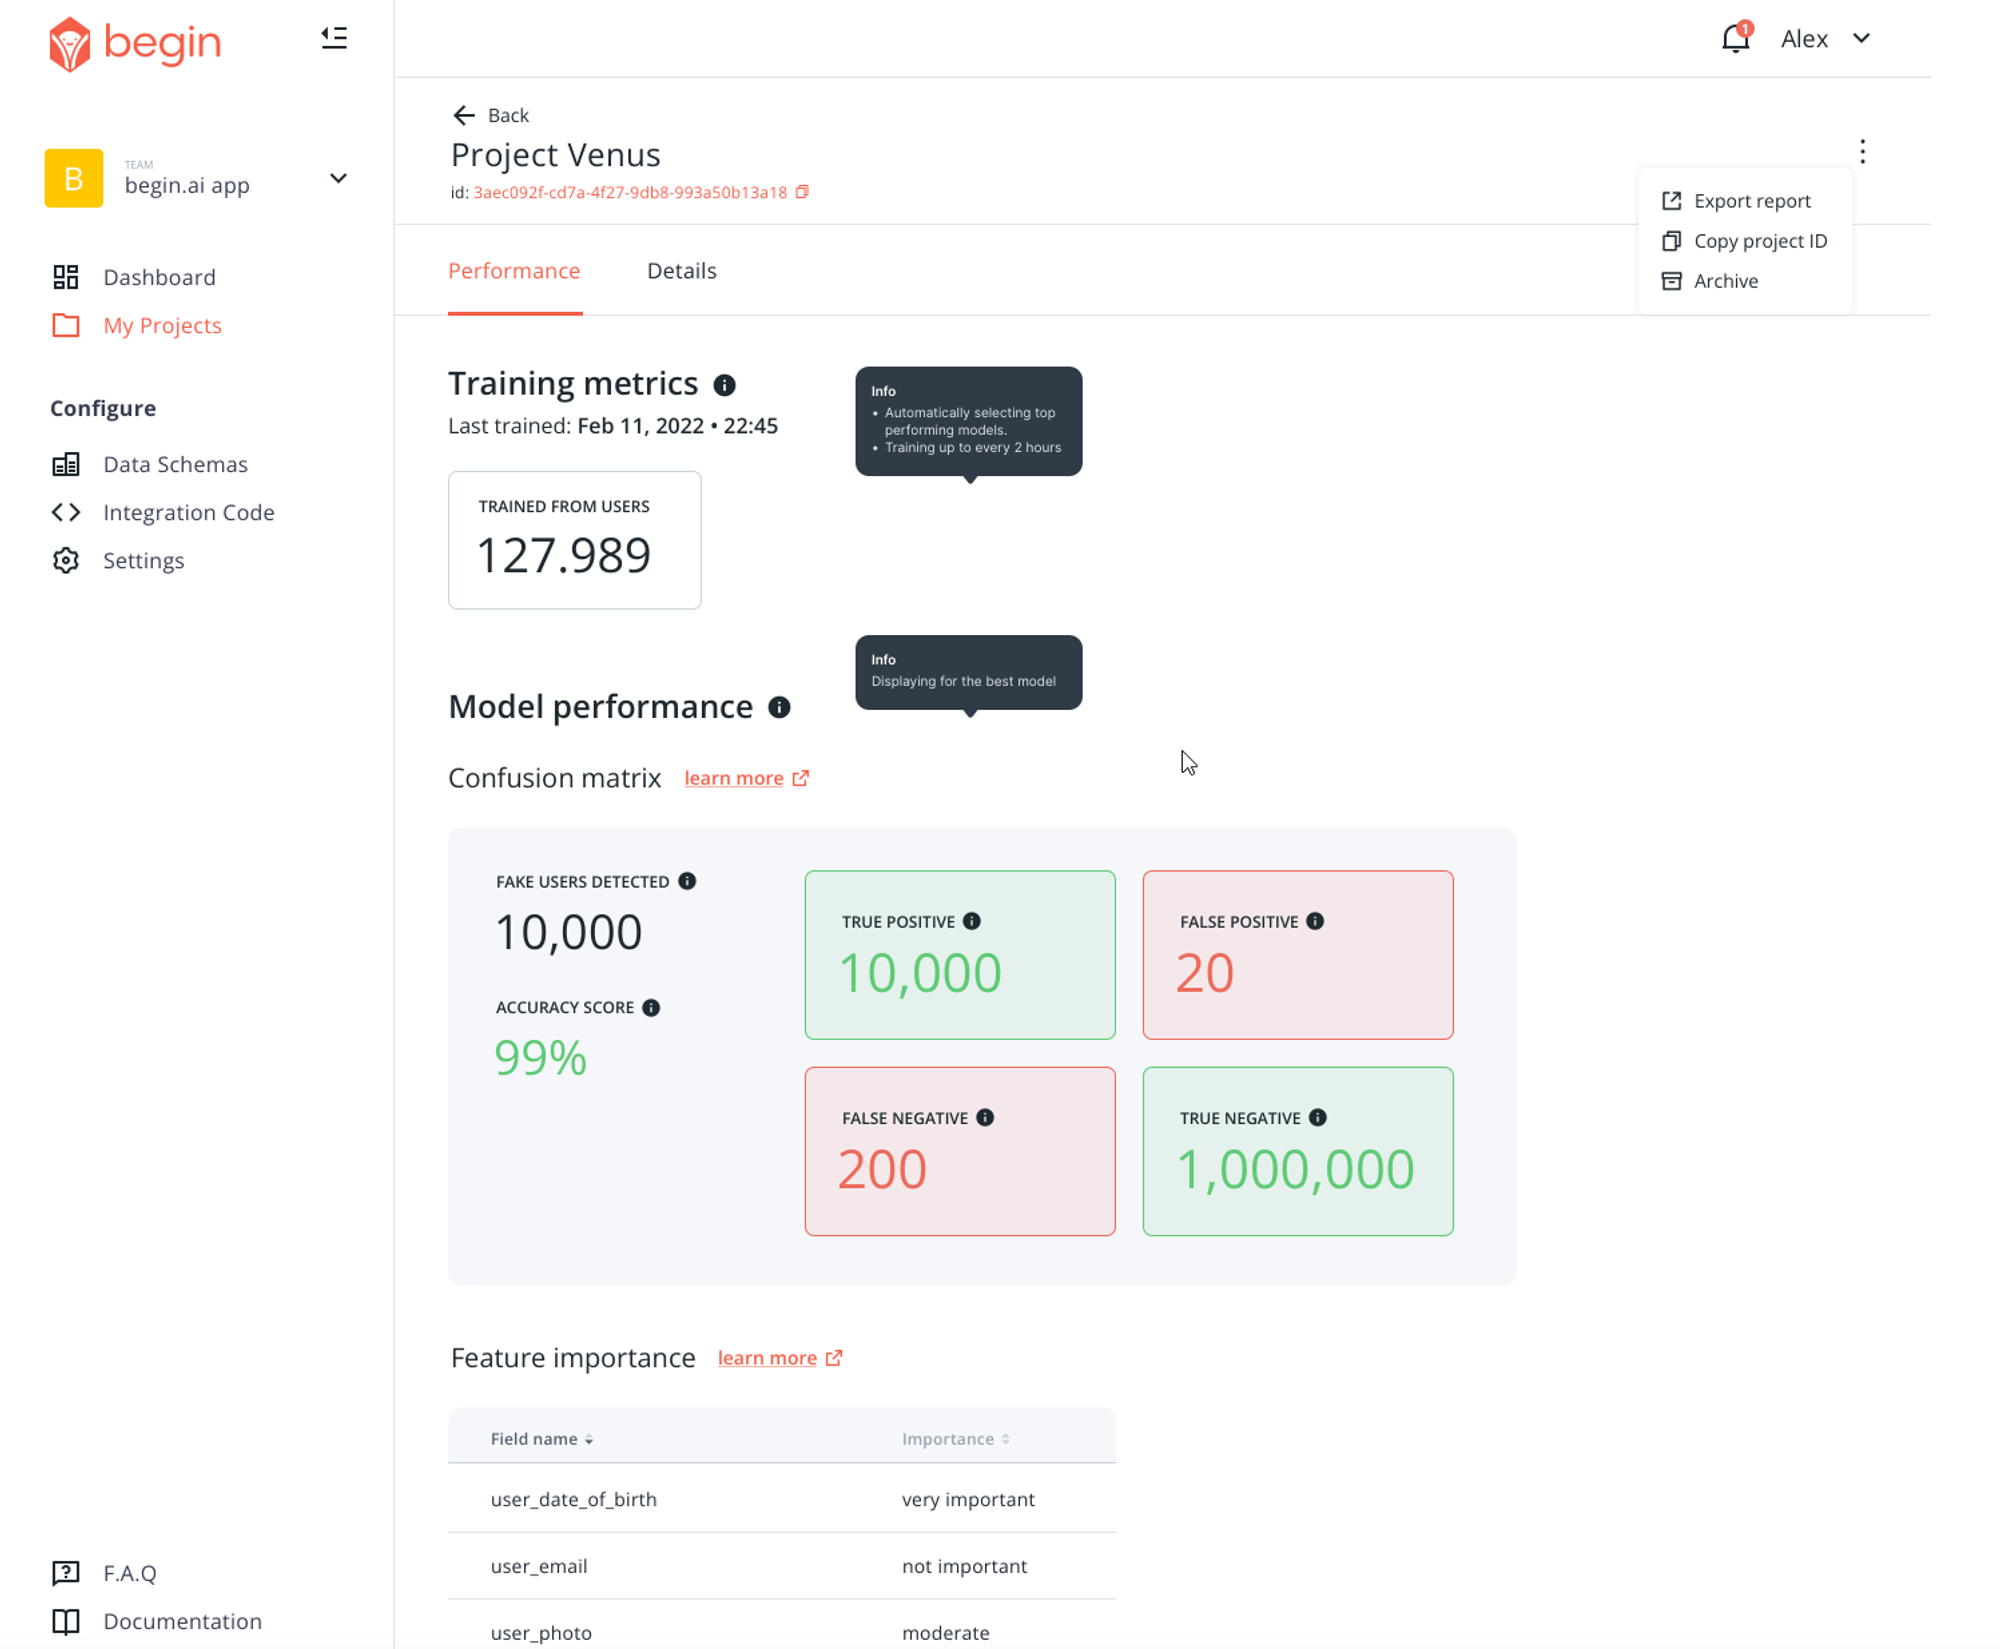
Training Metrics
Last Trained: indicates the last time this project processed learnings from your users’ data.
Trained from users: Indicates the amount of user data or interactions used to train this algorithm.
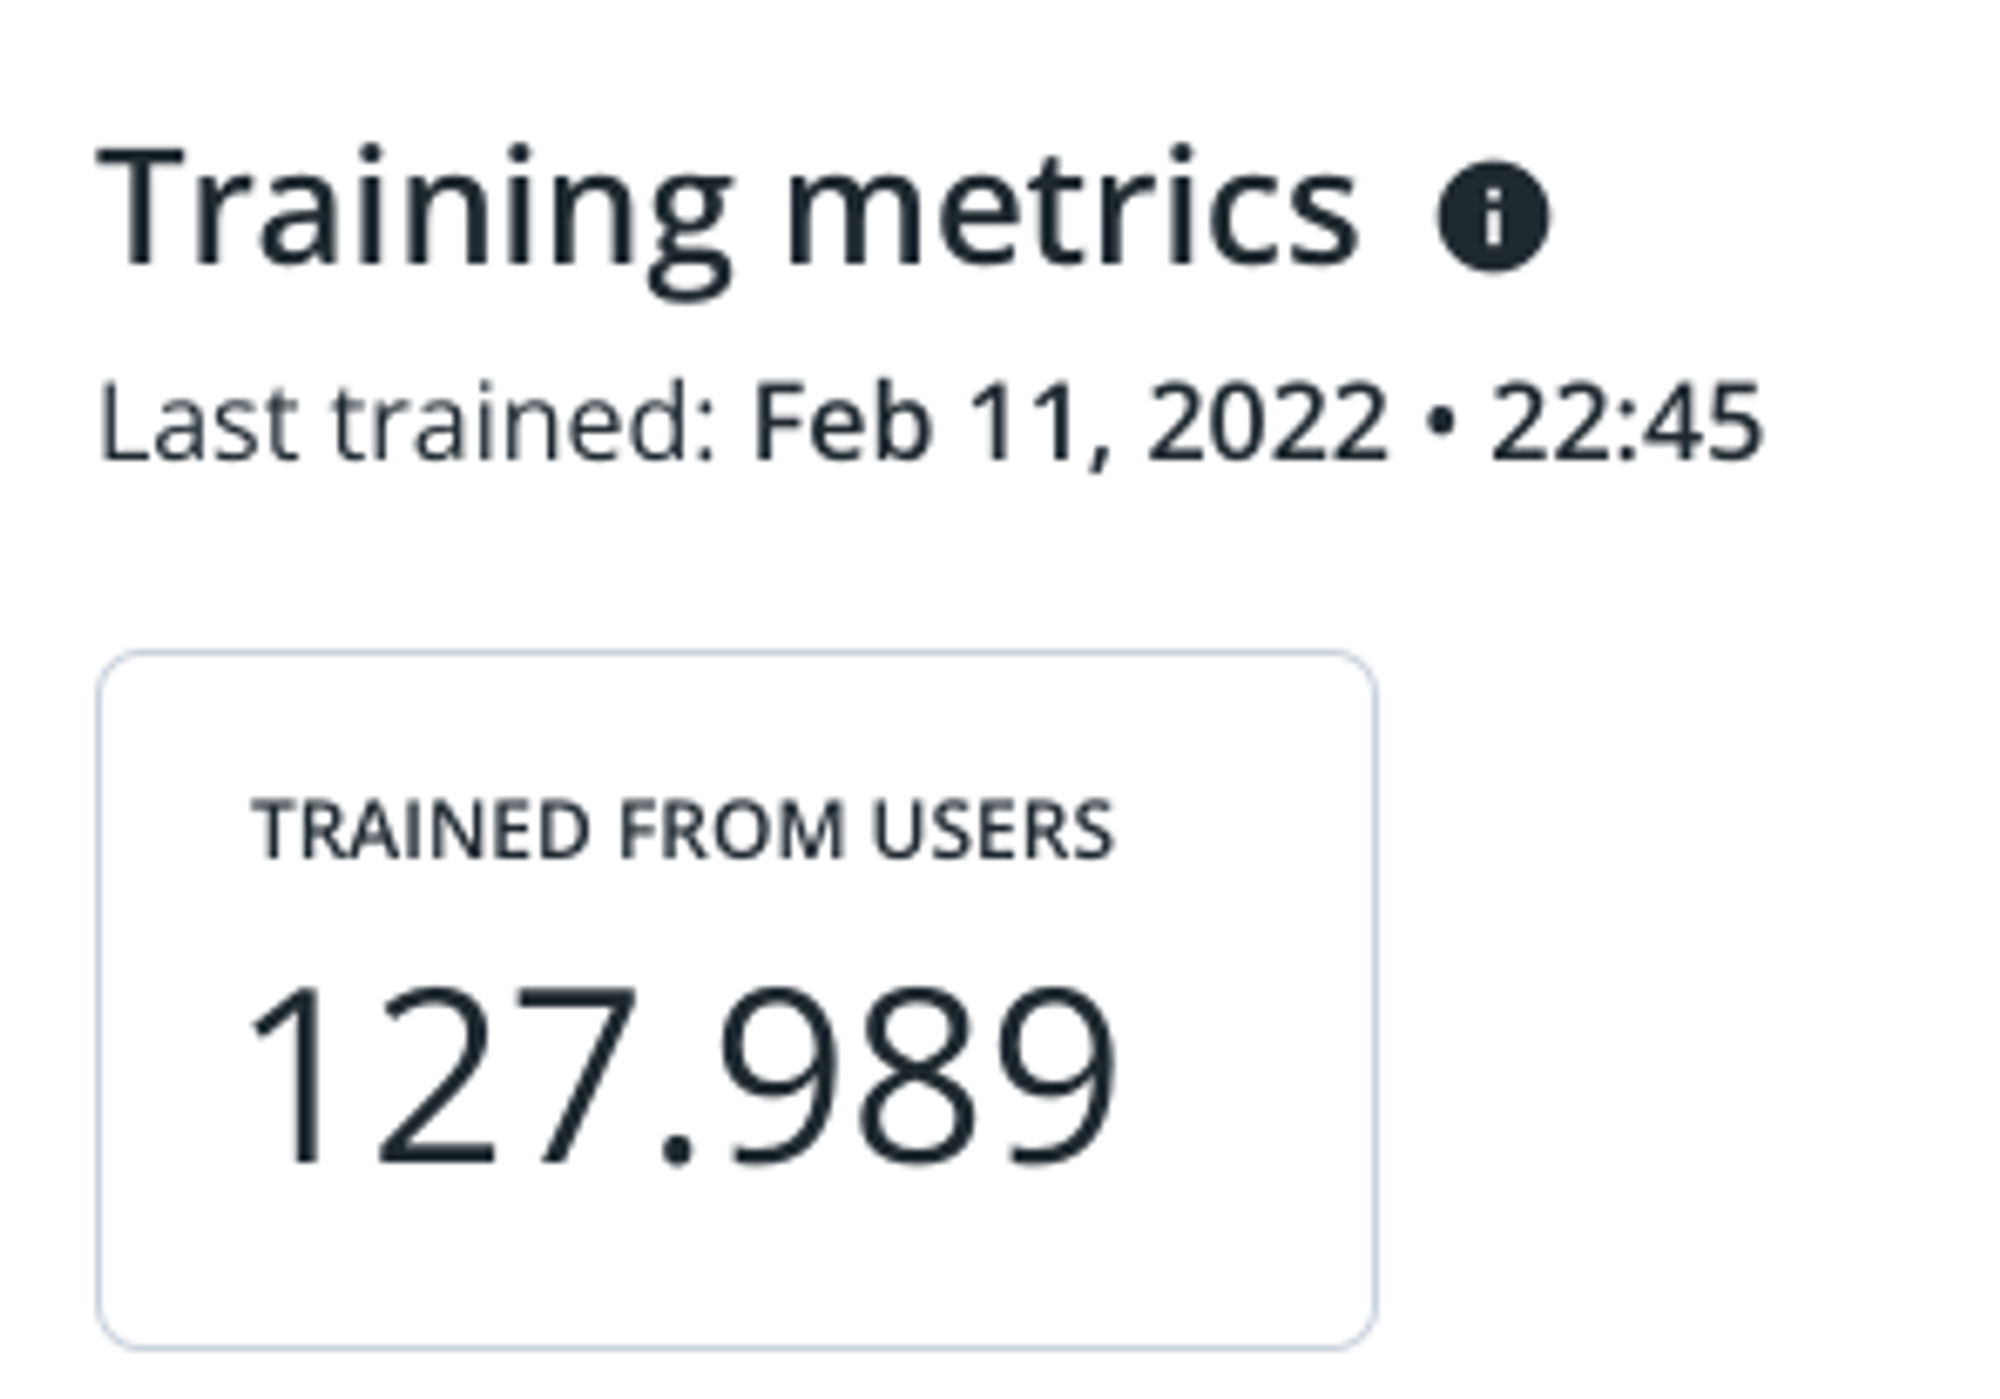
Confusion Matrix
The confusion matrix indicates the level of confidence your project has in its results. Each objective uses its own confusion matrix. We’ll break them down below.
Fake Profile Detection
Fake users detected: This indicates the number of fake profiles detected from the total training data pulled from users.
Accuracy Score: Percentage of true positive/negative results against the total trained from users.
True Positive/Negative: The number of profiles flagged as real/fake verified to be correct.
False Positive/Negative: The number of profiles flagged as real/fake verified to be incorrect.
Feature Importance: A list of key elements in a user’s profile the algorithm uses to identify if it’s real or fake.
Recommendation
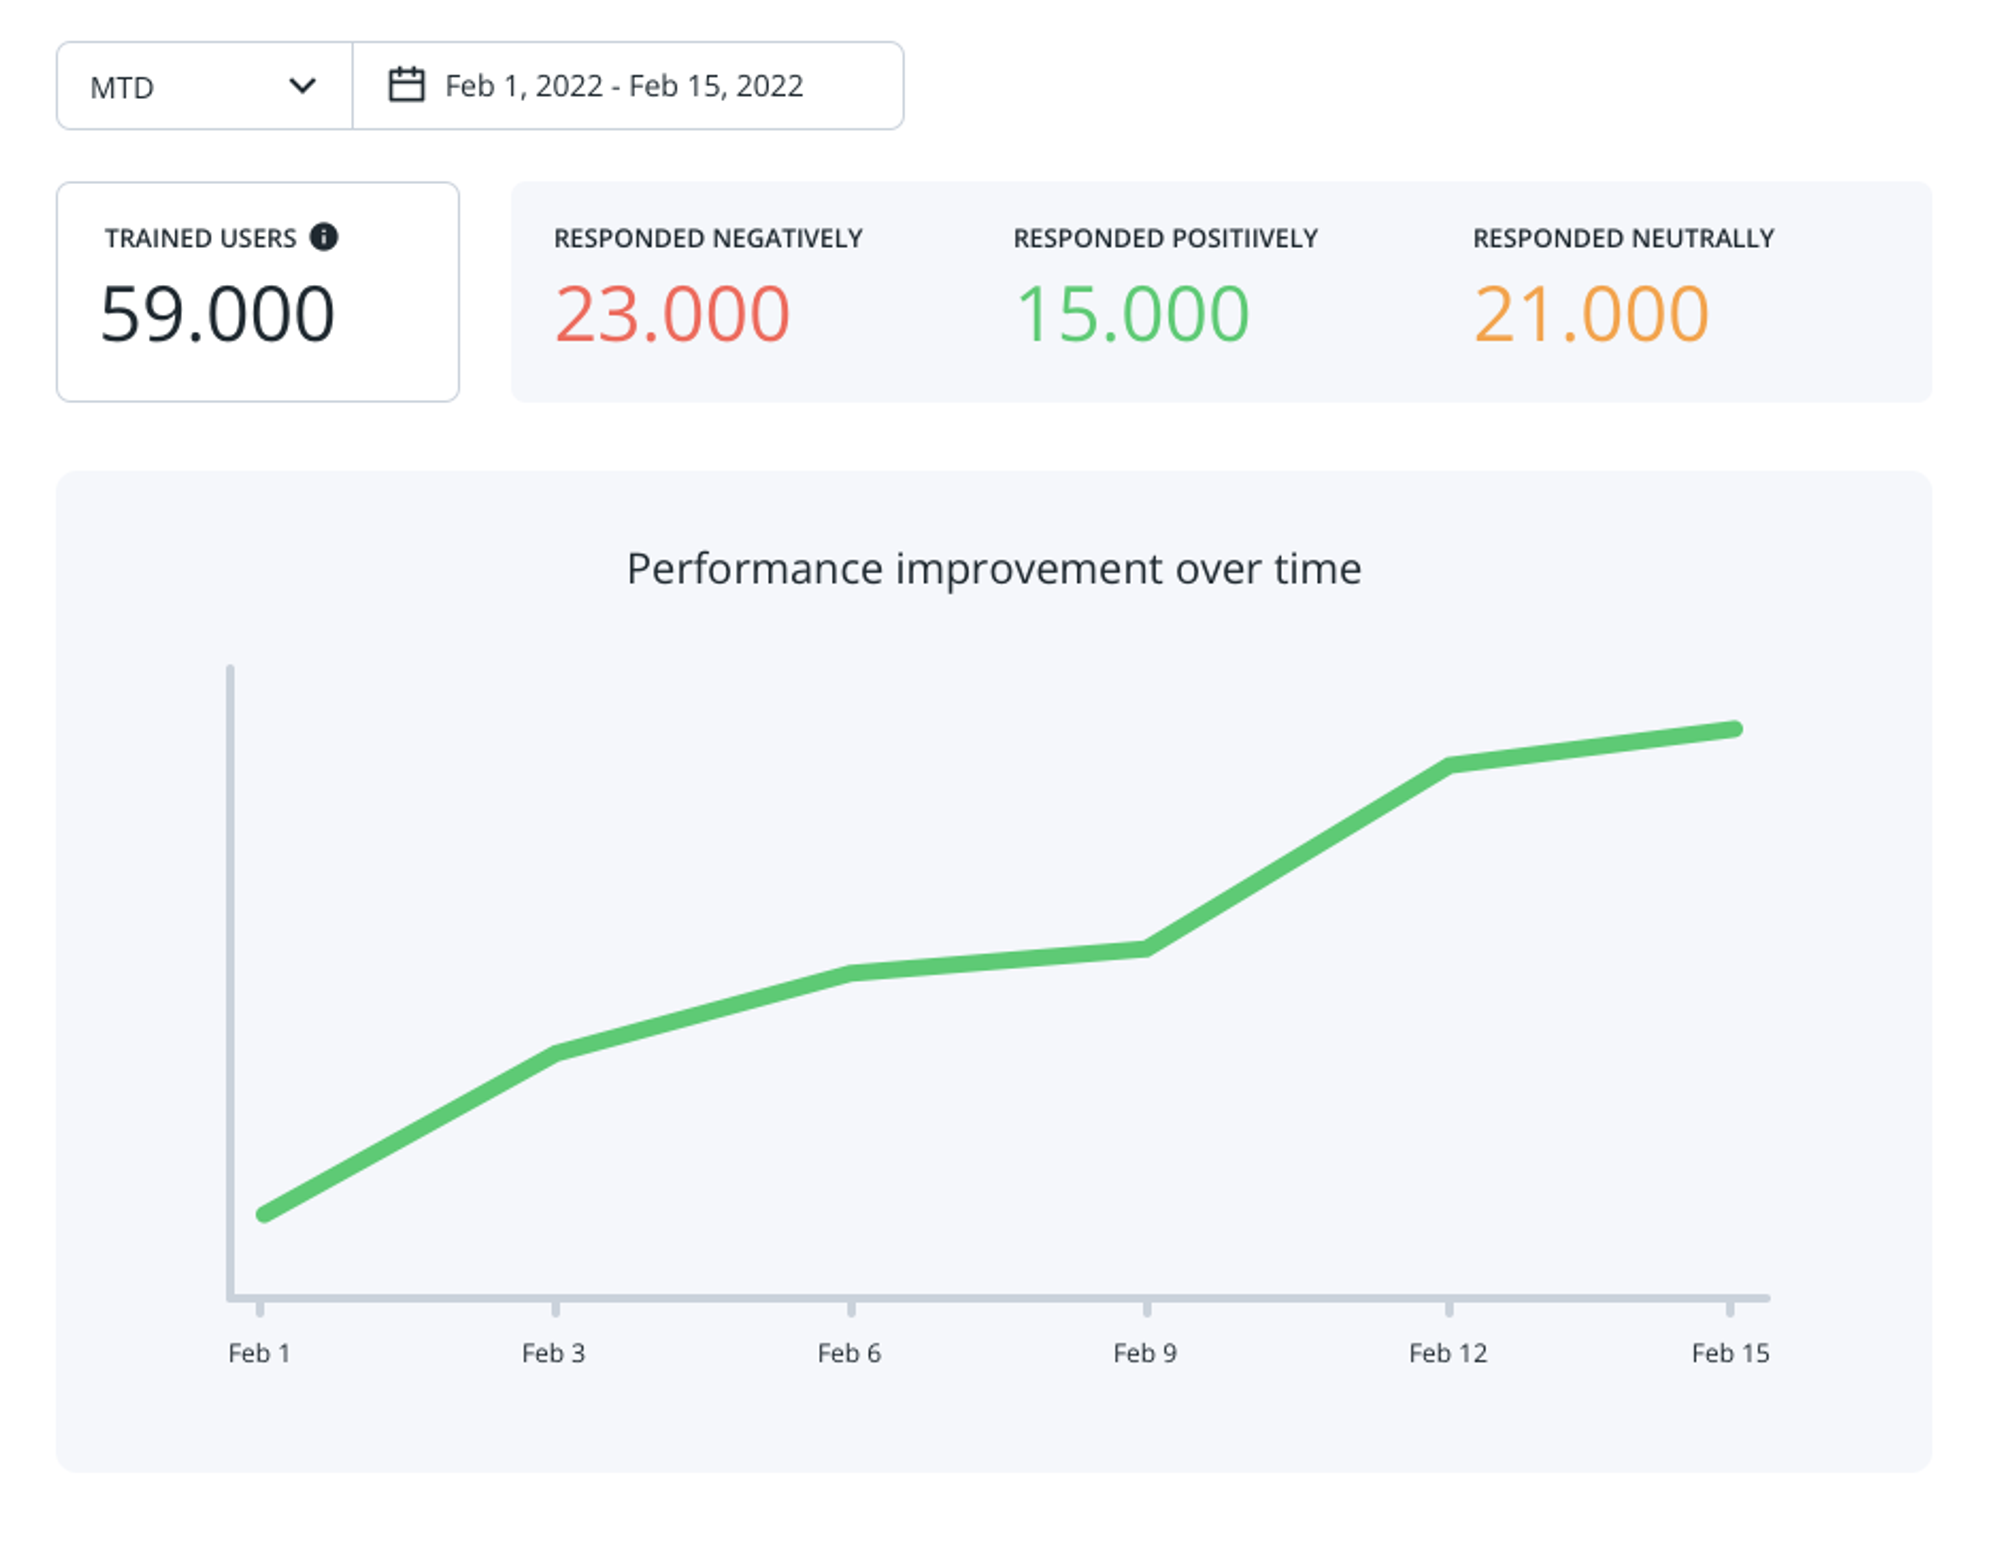
Trained users: The number of profiles used to train the algorithm.
Responses: Indicates, out of the total number of trained users, which ones responded positively, negatively, or neutrally.
Performance improvement over time: Indicates the number of positive responses received over a set timeframe.
Troubleshooting
Fake profile detection: low accuracy score.
- Check the feature importance list to see if it is correctly ranking user profile elements.
- Increase your data pool.
- Improve the attributes defined in your schema.