Data Insights
(Found under Dashboard)
Distribution Analysis
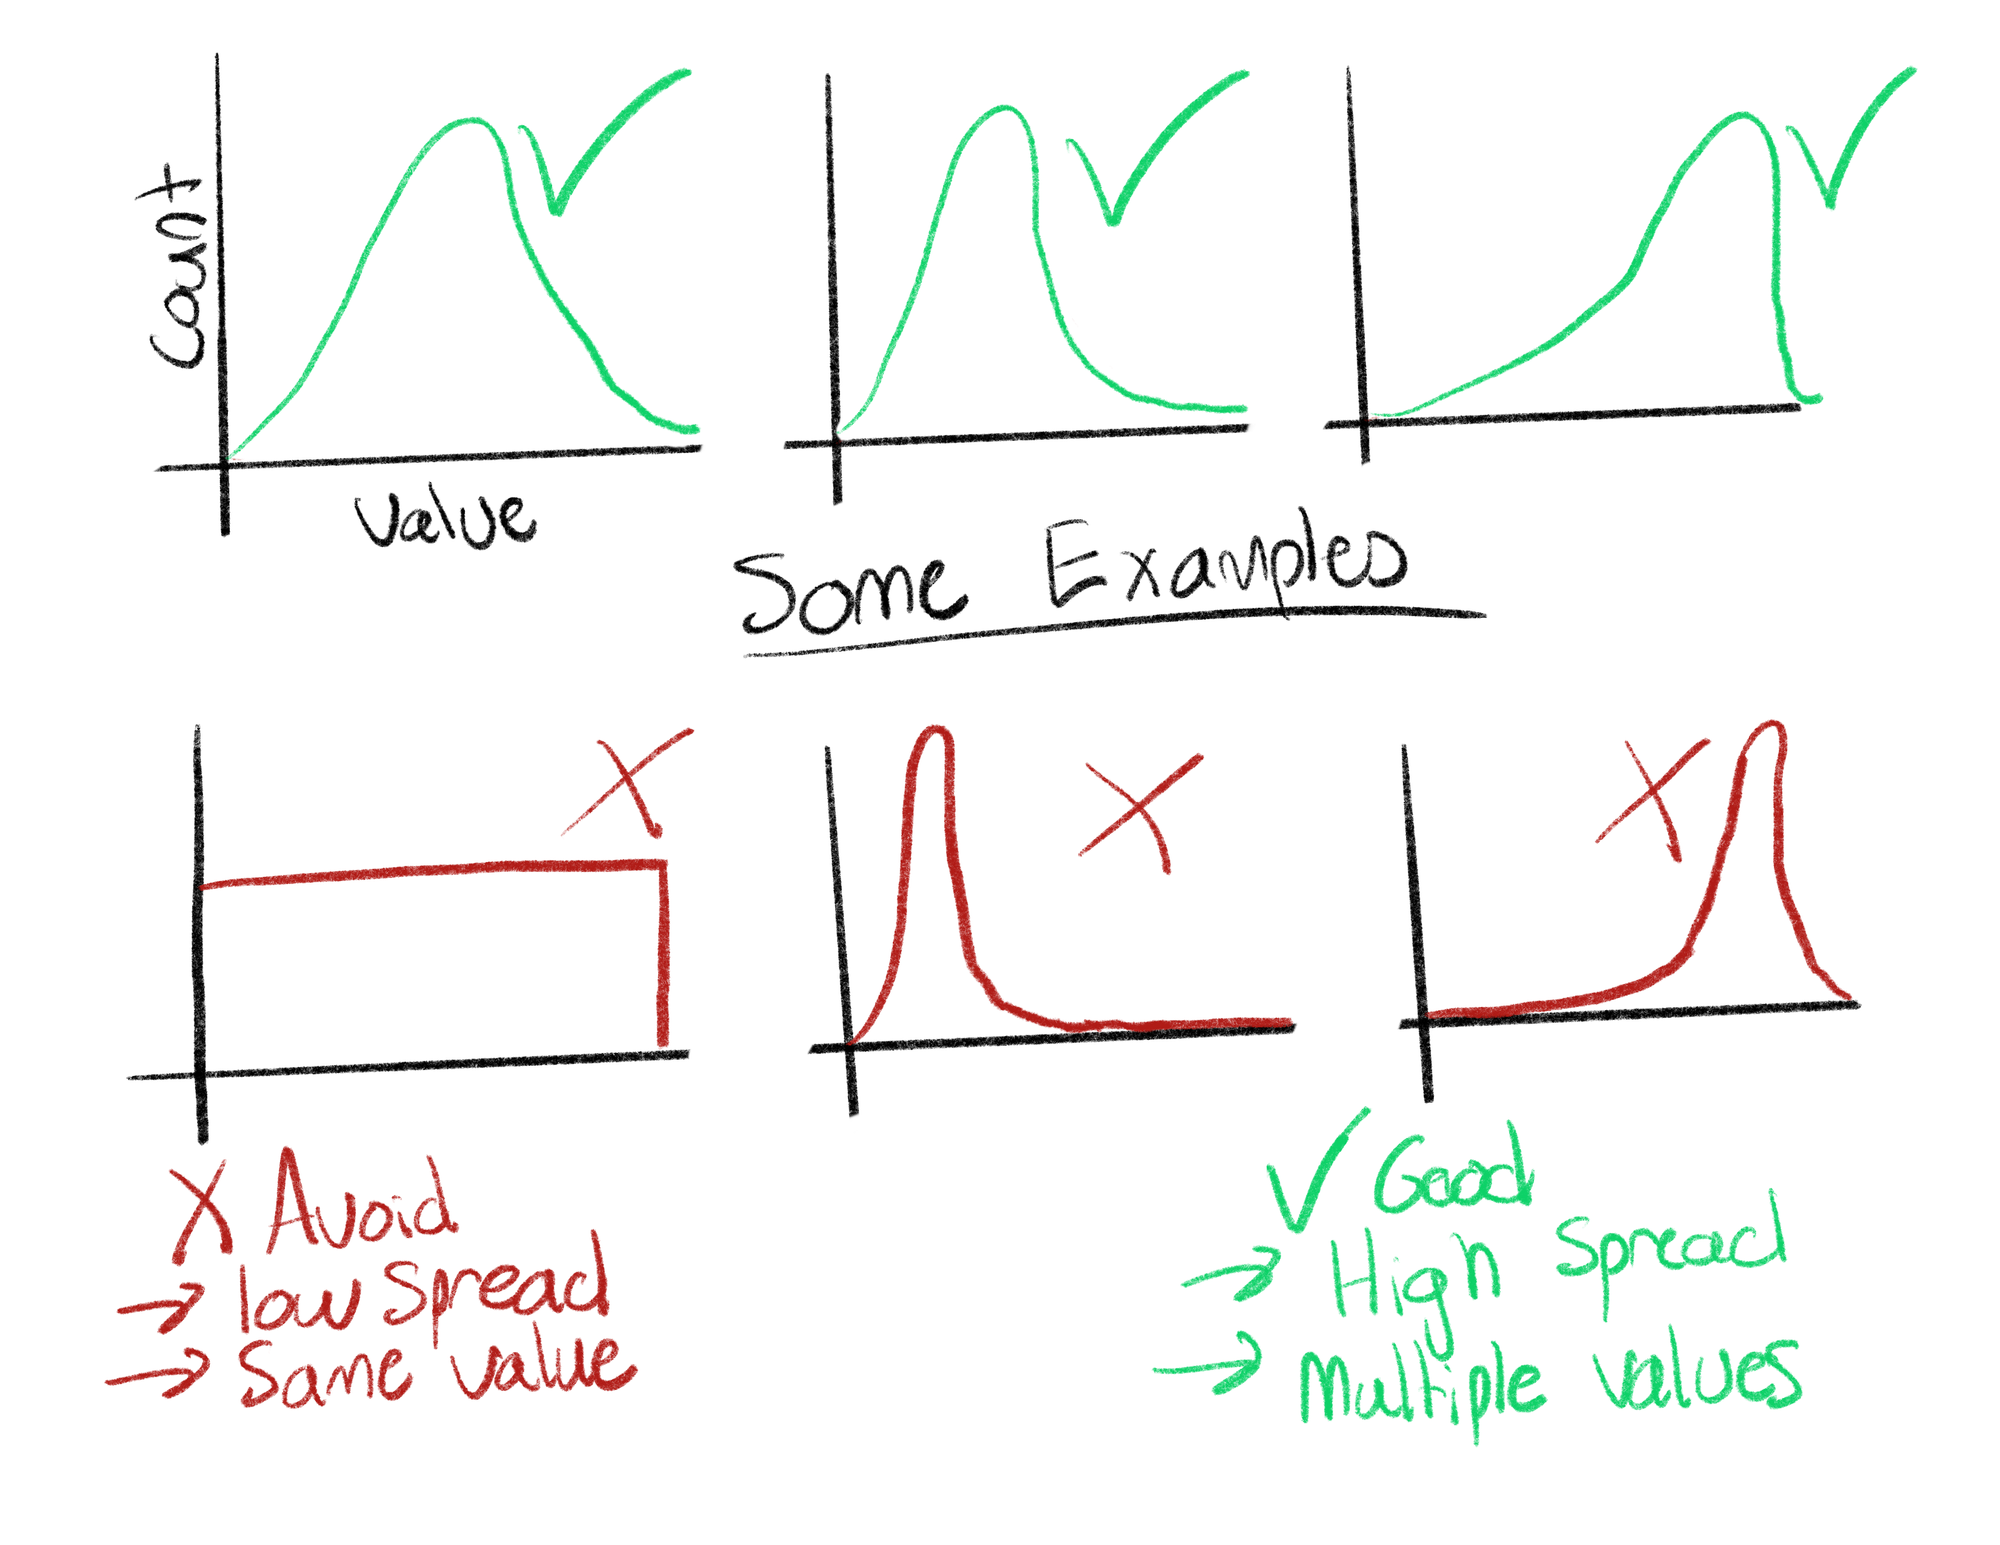
The distribution analysis organizes the embedded variables into plots that show the respective value and counts. These plots can be referenced as distribution plots and give users a quick snapshot of their underlying data. Through this graph users can see if their data is skewed, the expected range, or the average expected value (mean) for all their variables.
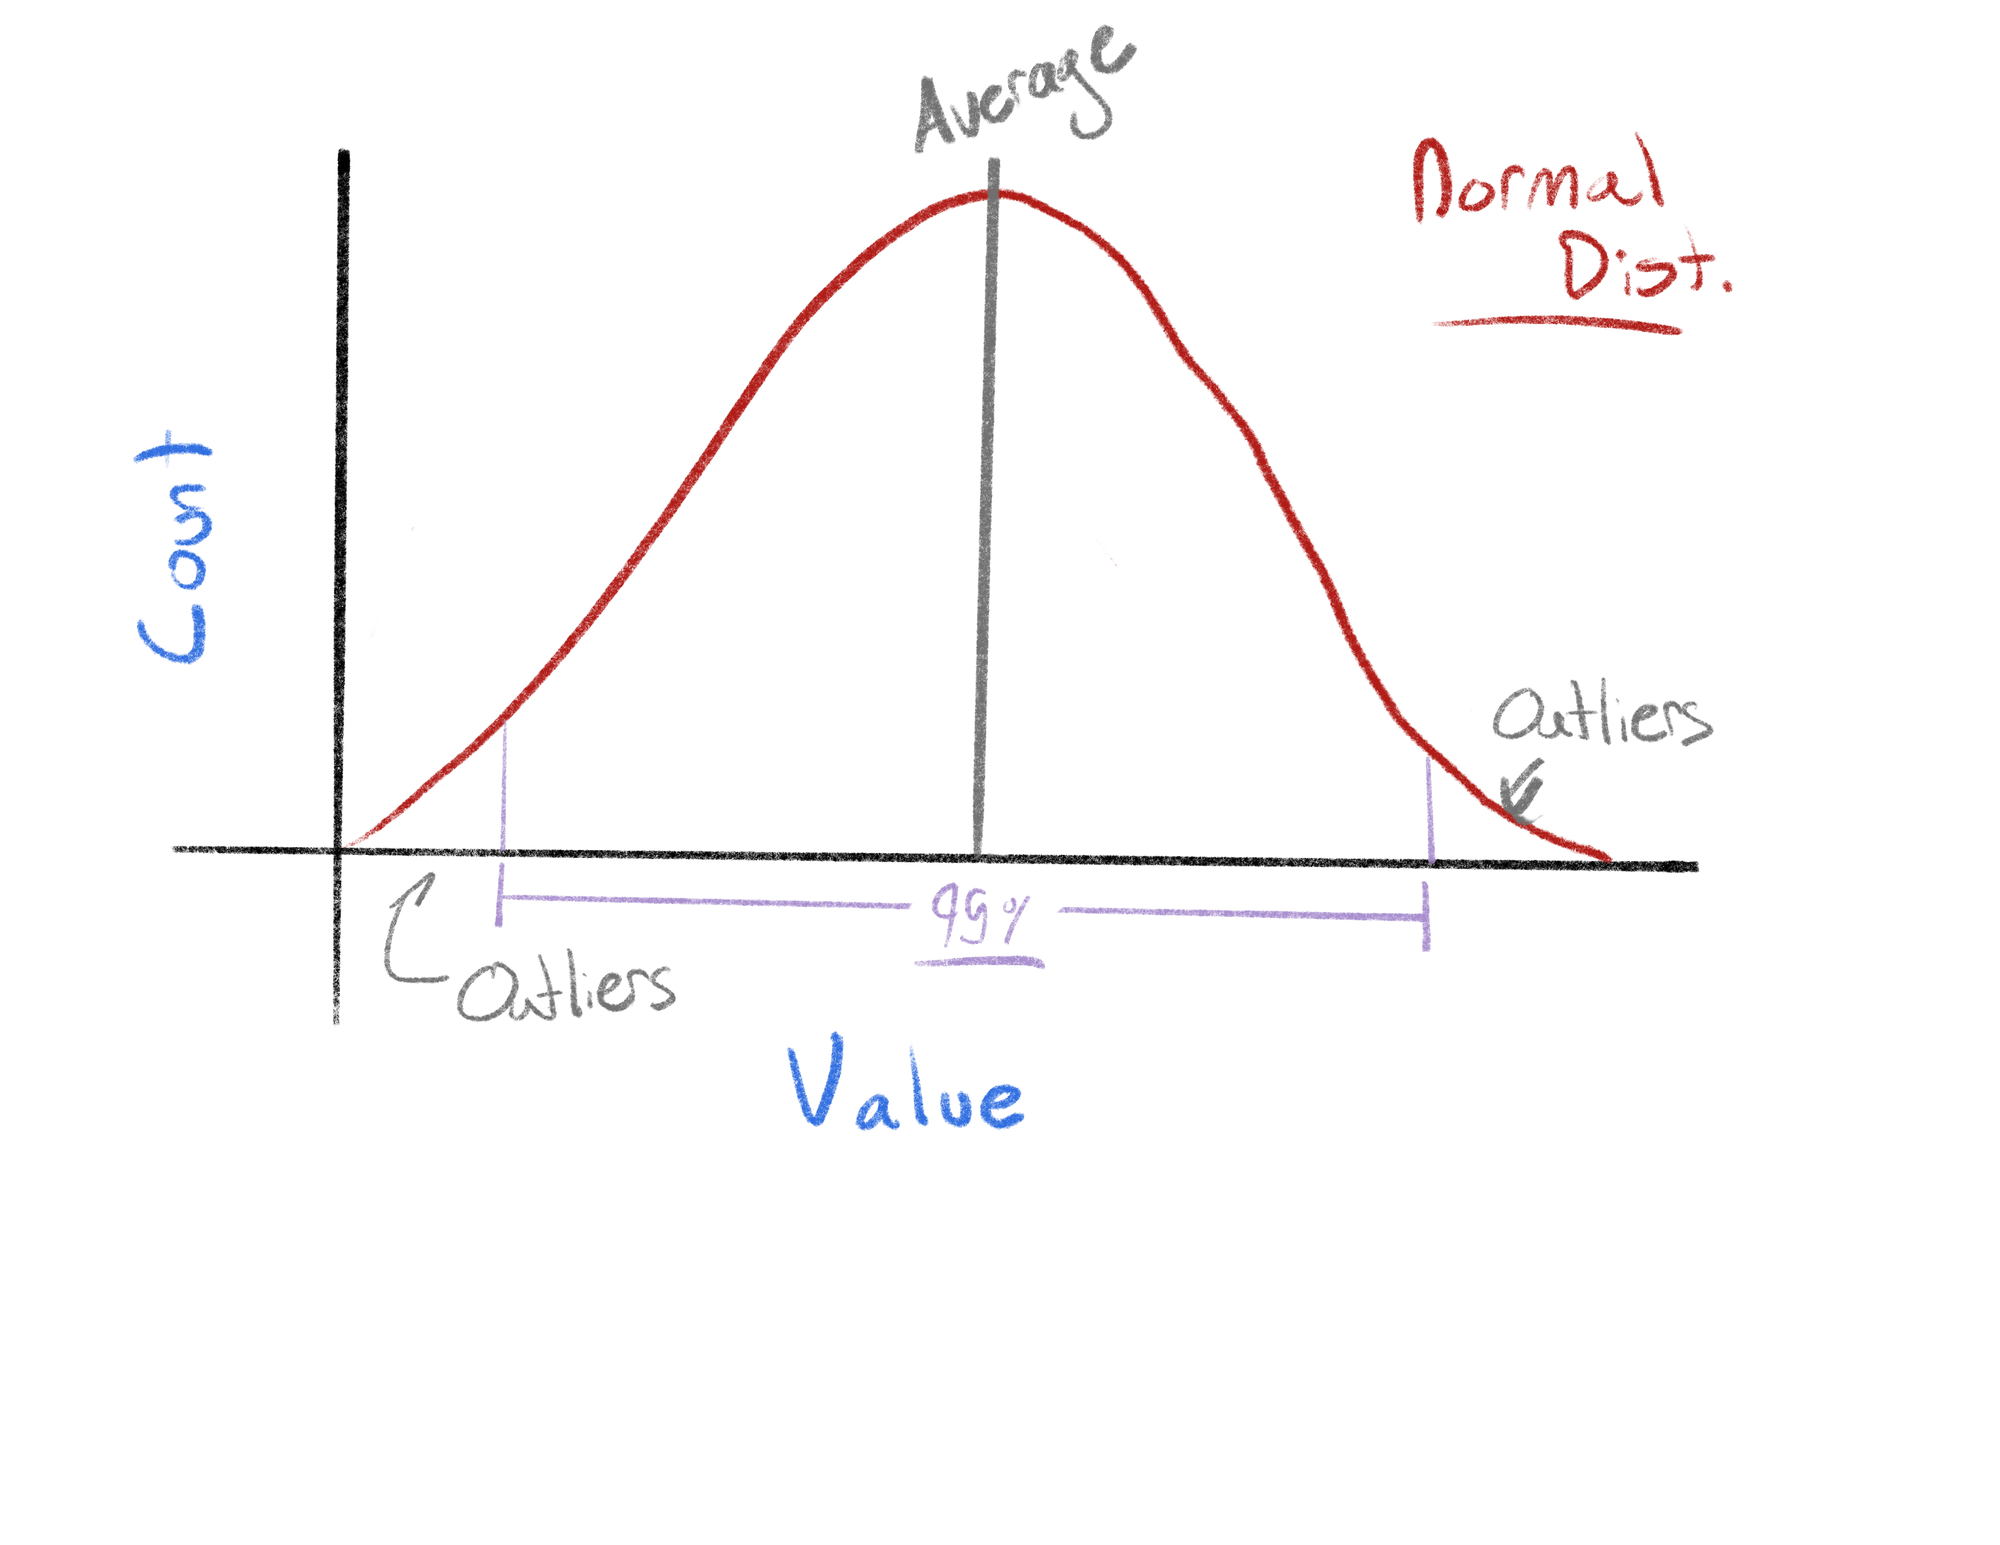
There are concepts of good and bad distributions, ideally all of our data would have a normal distribution (symmetrical); however, this is not always the case. Heavily skewed data is sometimes not useful in machine learning applications because there can be a lack of diverse information. If the value of a variable is always the same, we can’t really learn anything from it. Distributions plots allow users to see all this information at a glance and make quick decisions about what information is and is not useful.
Variance Analysis
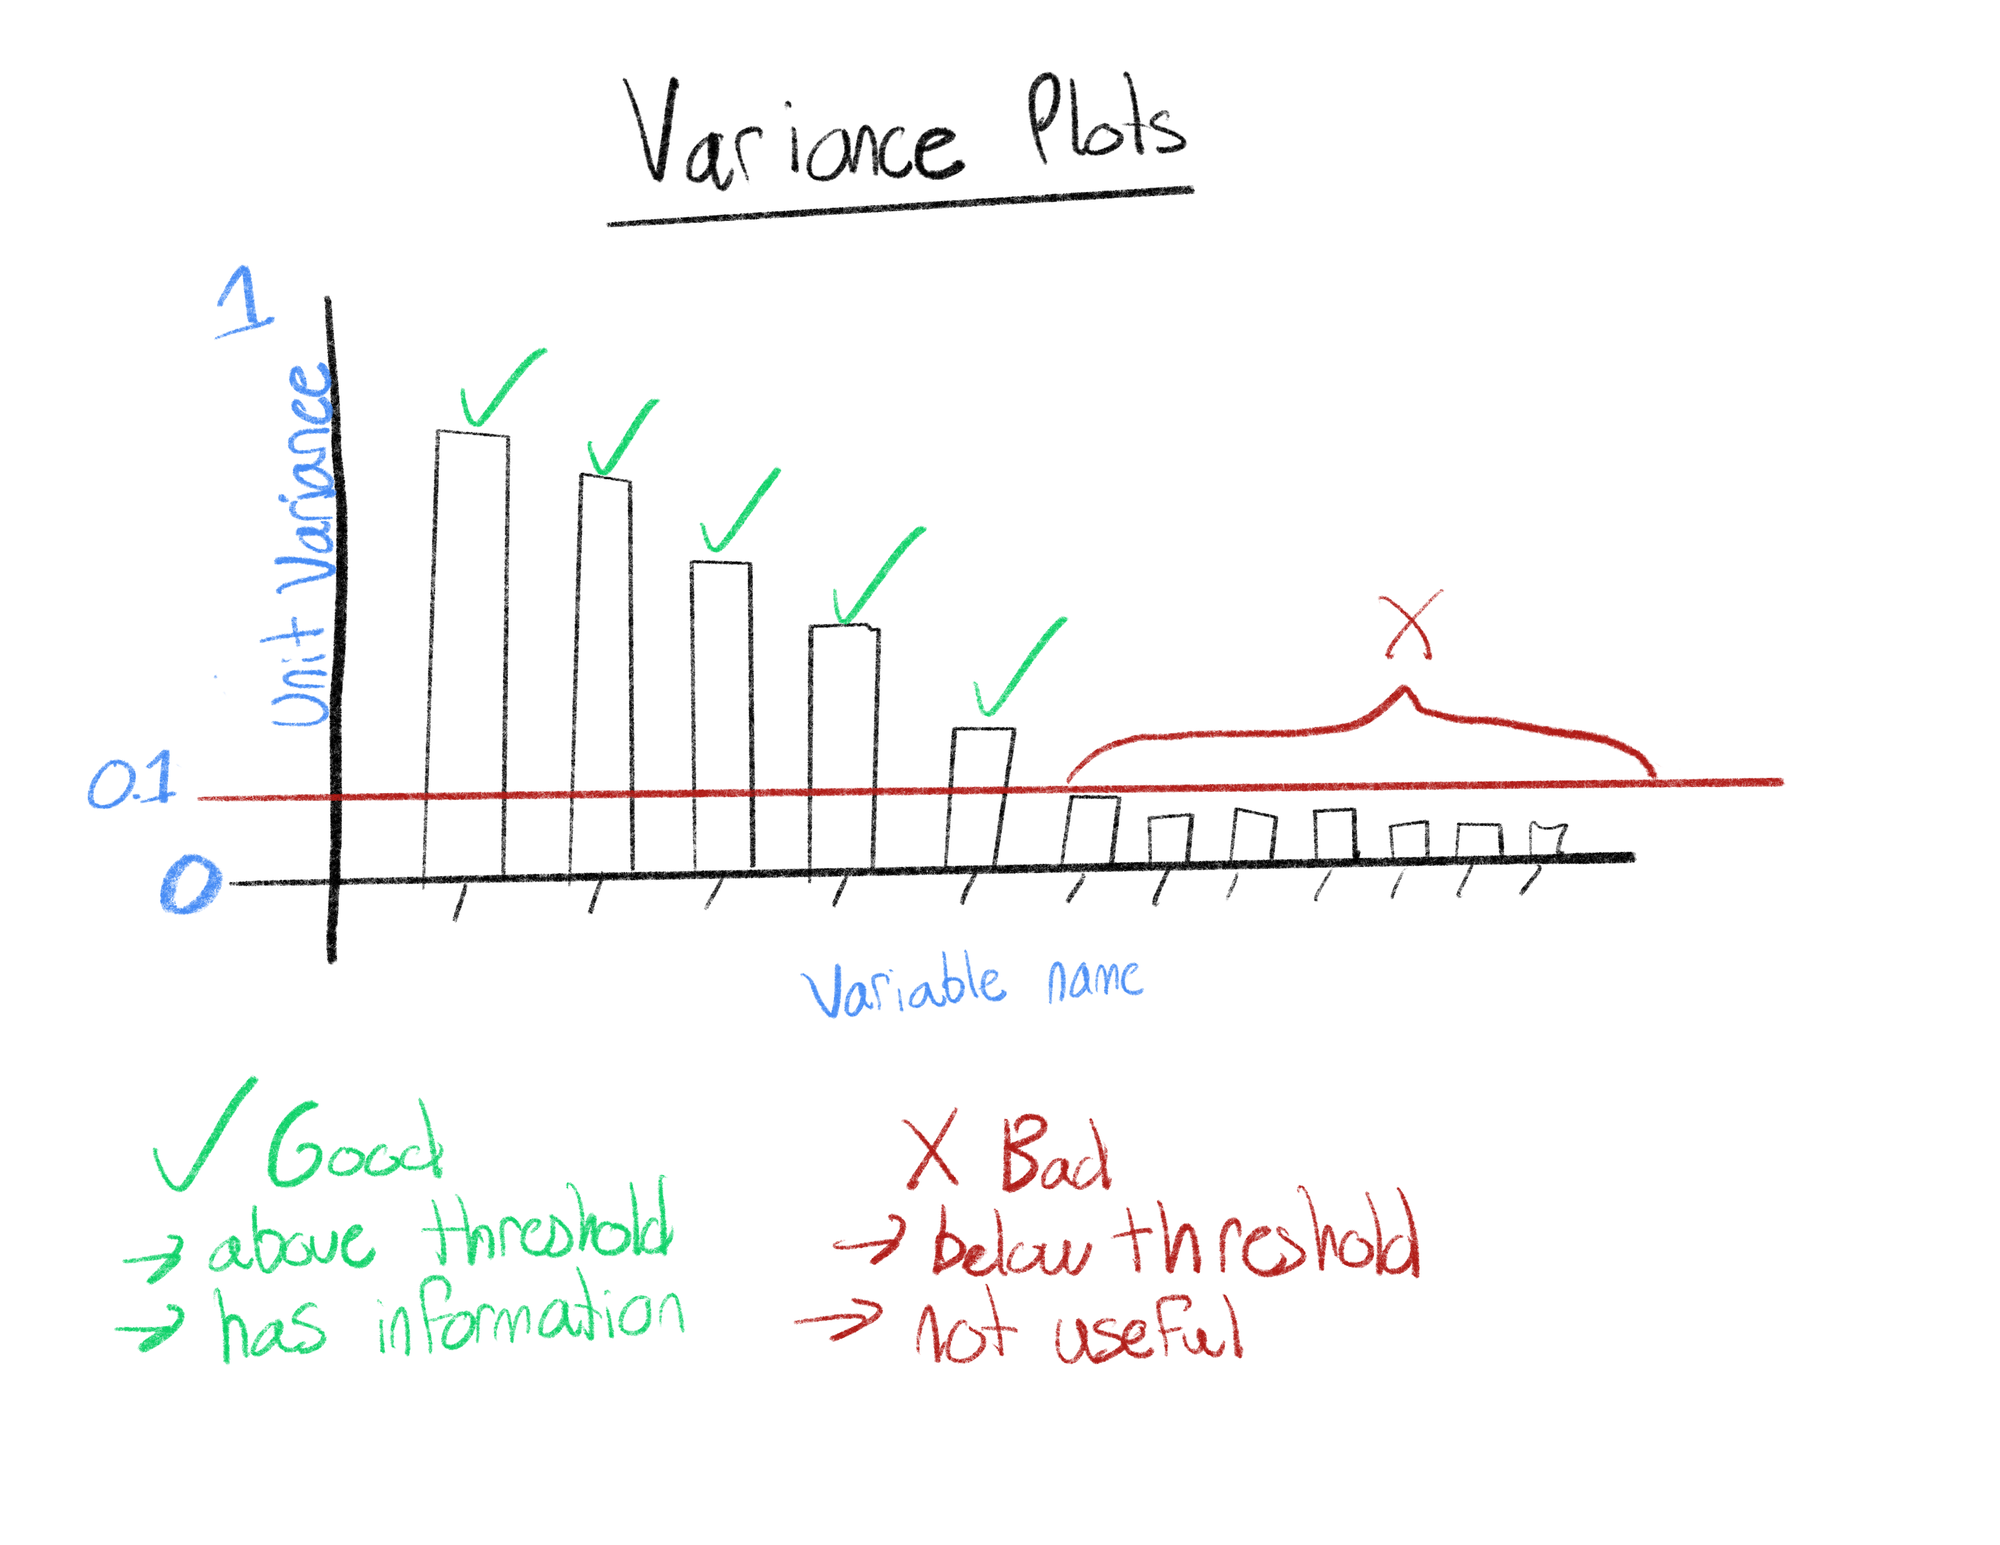
Variance analysis is a measure of a variable's overall “spread”, similar information can be obtained from a distribution analysis; however, it is often easier to observe this information as a number. This analysis uses unit variance, where the value is measured between 0 and 1. Variables with a unit variance of 0 have no spread (the variable has the same value for all the data). We consider variables with a unit variance below 0.1 as not containing enough information to be useful in machine learning applications and often are not useful for gathering insights.
Clustering Analysis
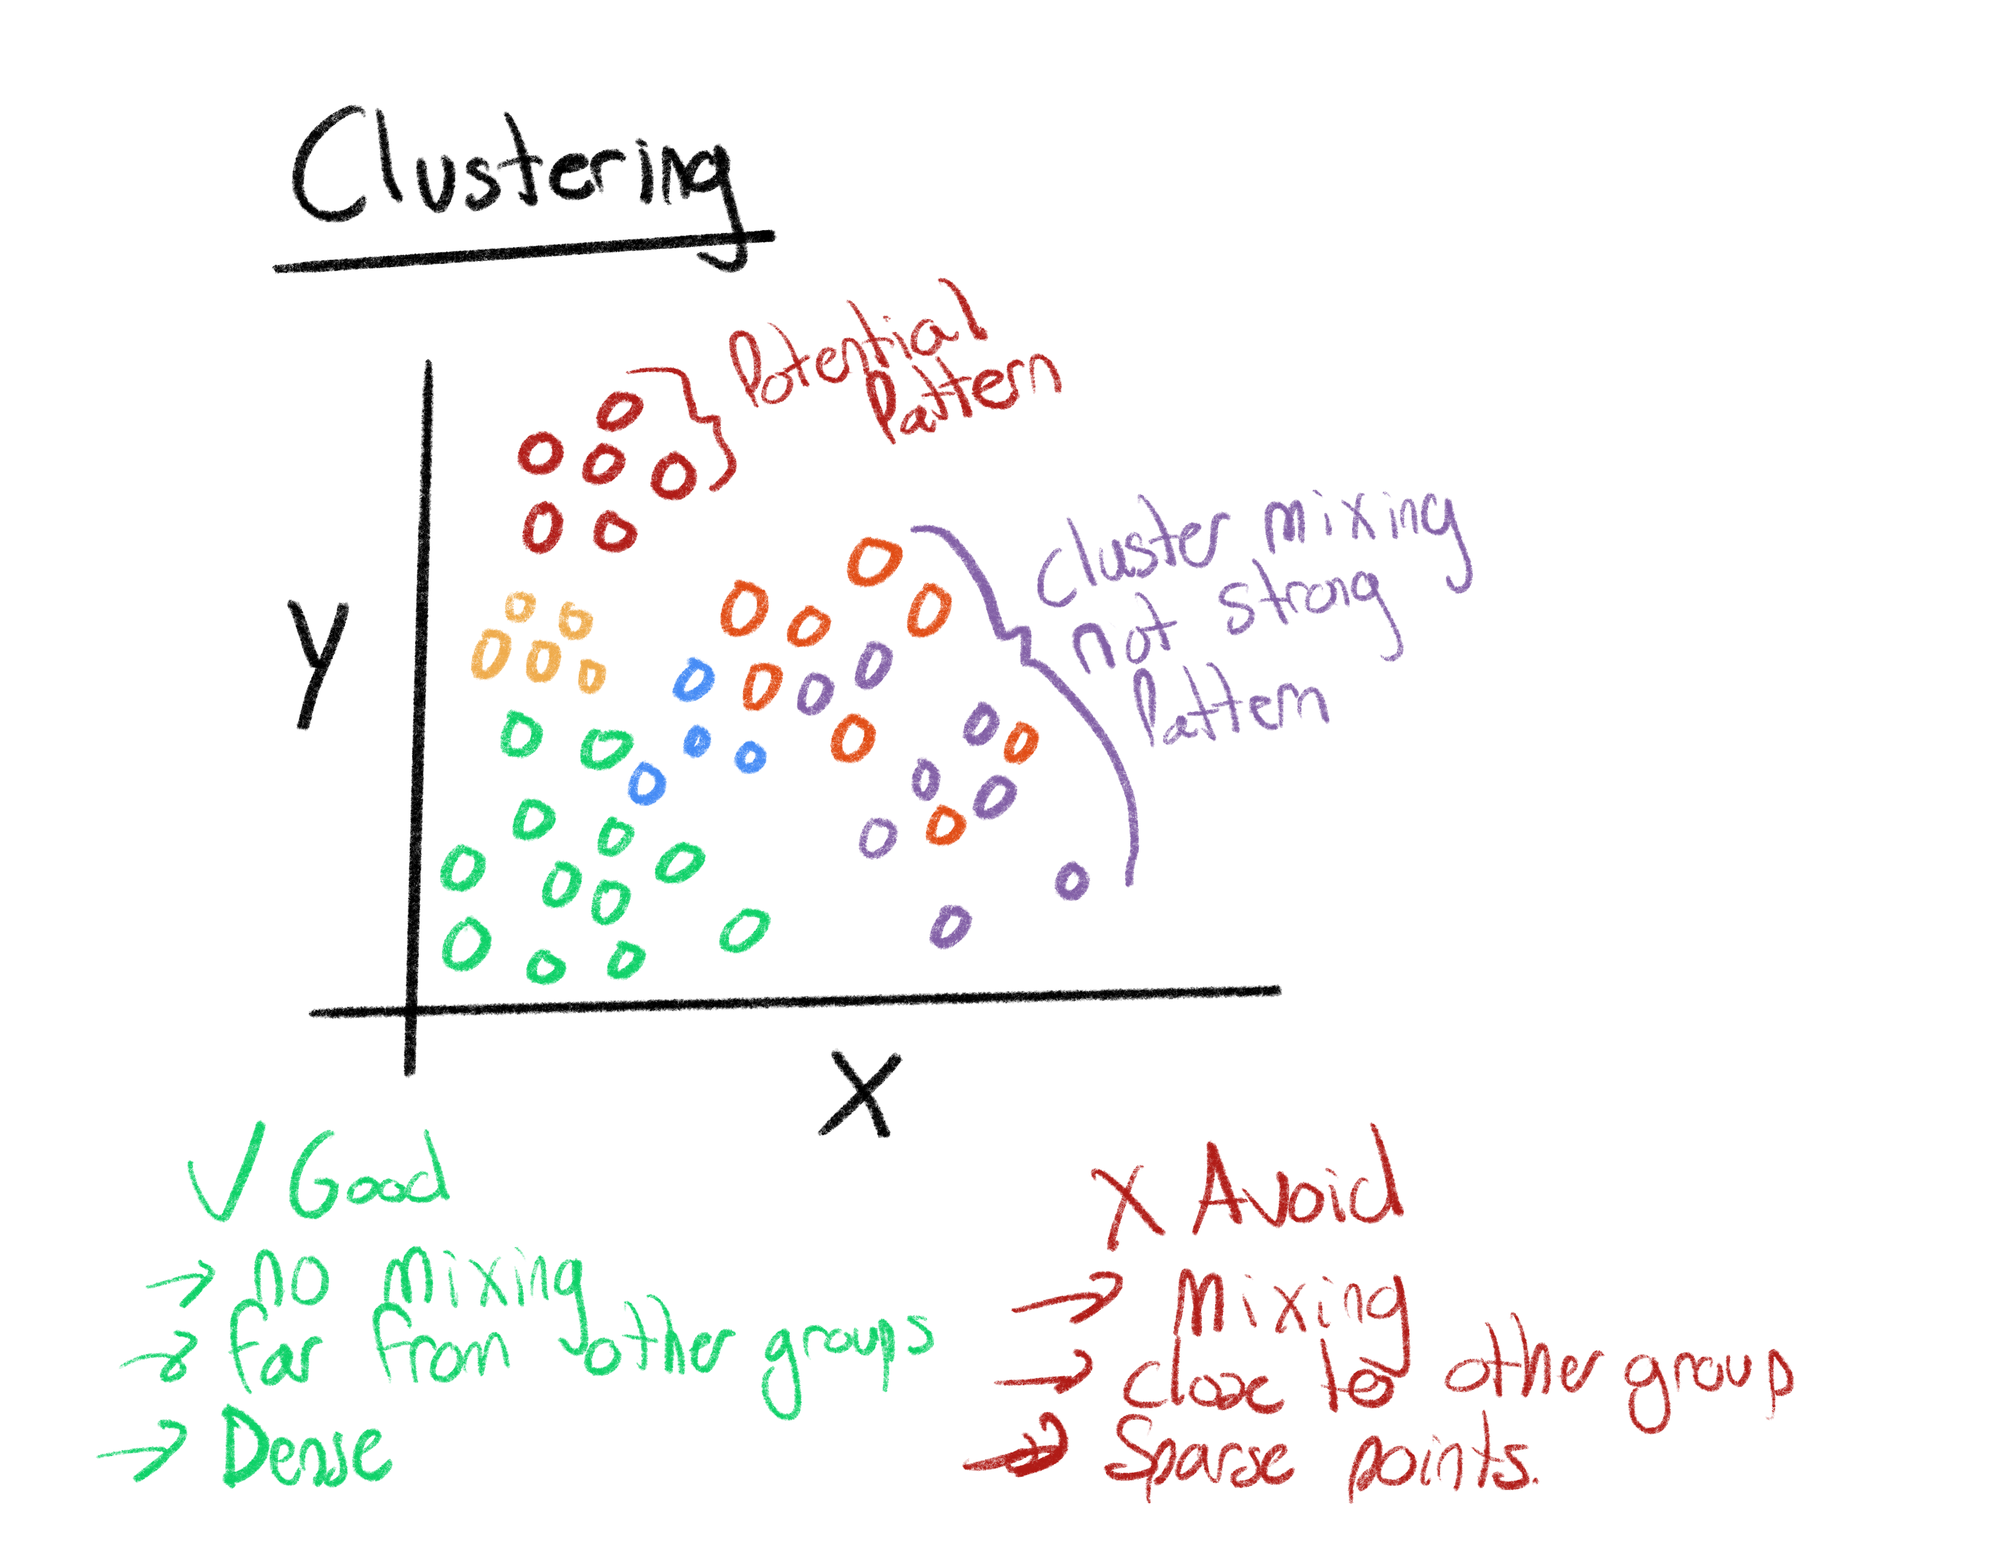
Clustering is a type of unsupervised machine learning, that does not require labels to be identified or defined. Clustering is the process of grouping objects (users, products, books, movies, etc.) together based on their underlying variables (colors, size, activity, average rating, author, etc.). Clustering allows users to see if there are any underlying patterns, or structures, in their data without having to identify any labels, or configure a more complicated machine learning workflow.
Trend Analysis
The trend analysis is specific for temporal-based data, where some measurement can be observed overtime. The process of a trend analysis is to calculate the general trend, or direction, of some measurement overtime and display this line as reference.
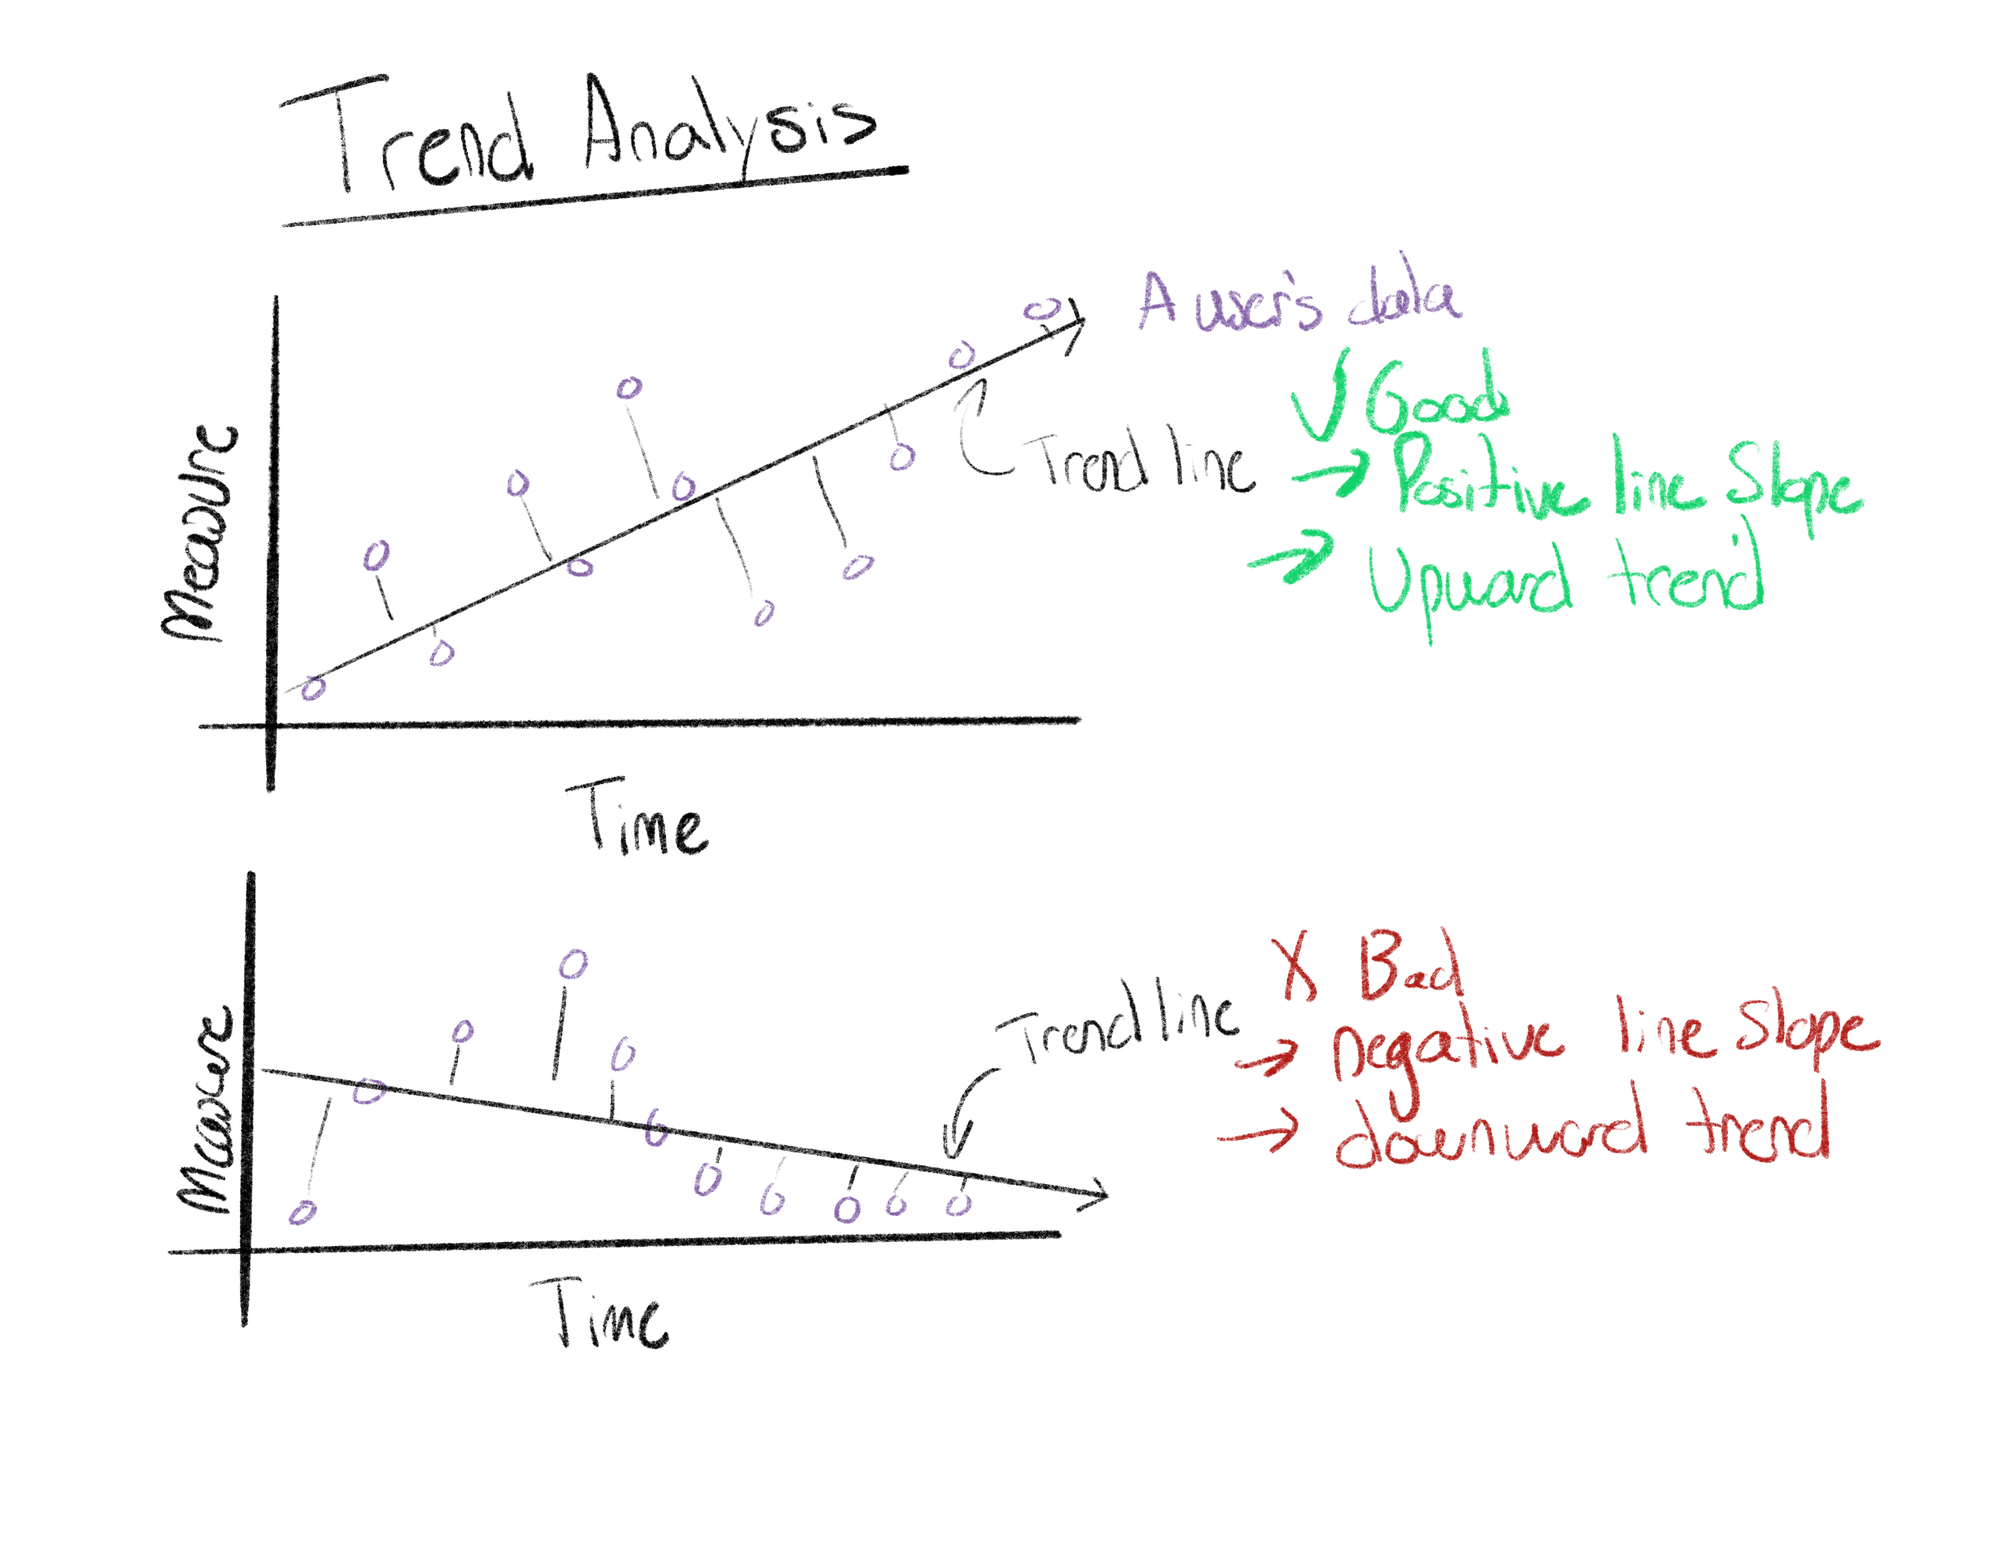
For instance, when measuring user engagement we can model a user’s total number of interactions, or actions, with an app overtime. From this we can calculate a user’s general trend and provide it as reference. This gives product managers a view into if a user’s engagement is increasing, or decreasing, so corrective action can be made before a possible churn event occurs.
Additionally, it is also possible to view aggregates of these trend lines which can represent the general trend of the top 10 users, or the general trend of the bottom 10 users. These aggregate lines can be used as a reference to determine if a user is under performing or over performing with respect to the overall userbase’s trend.
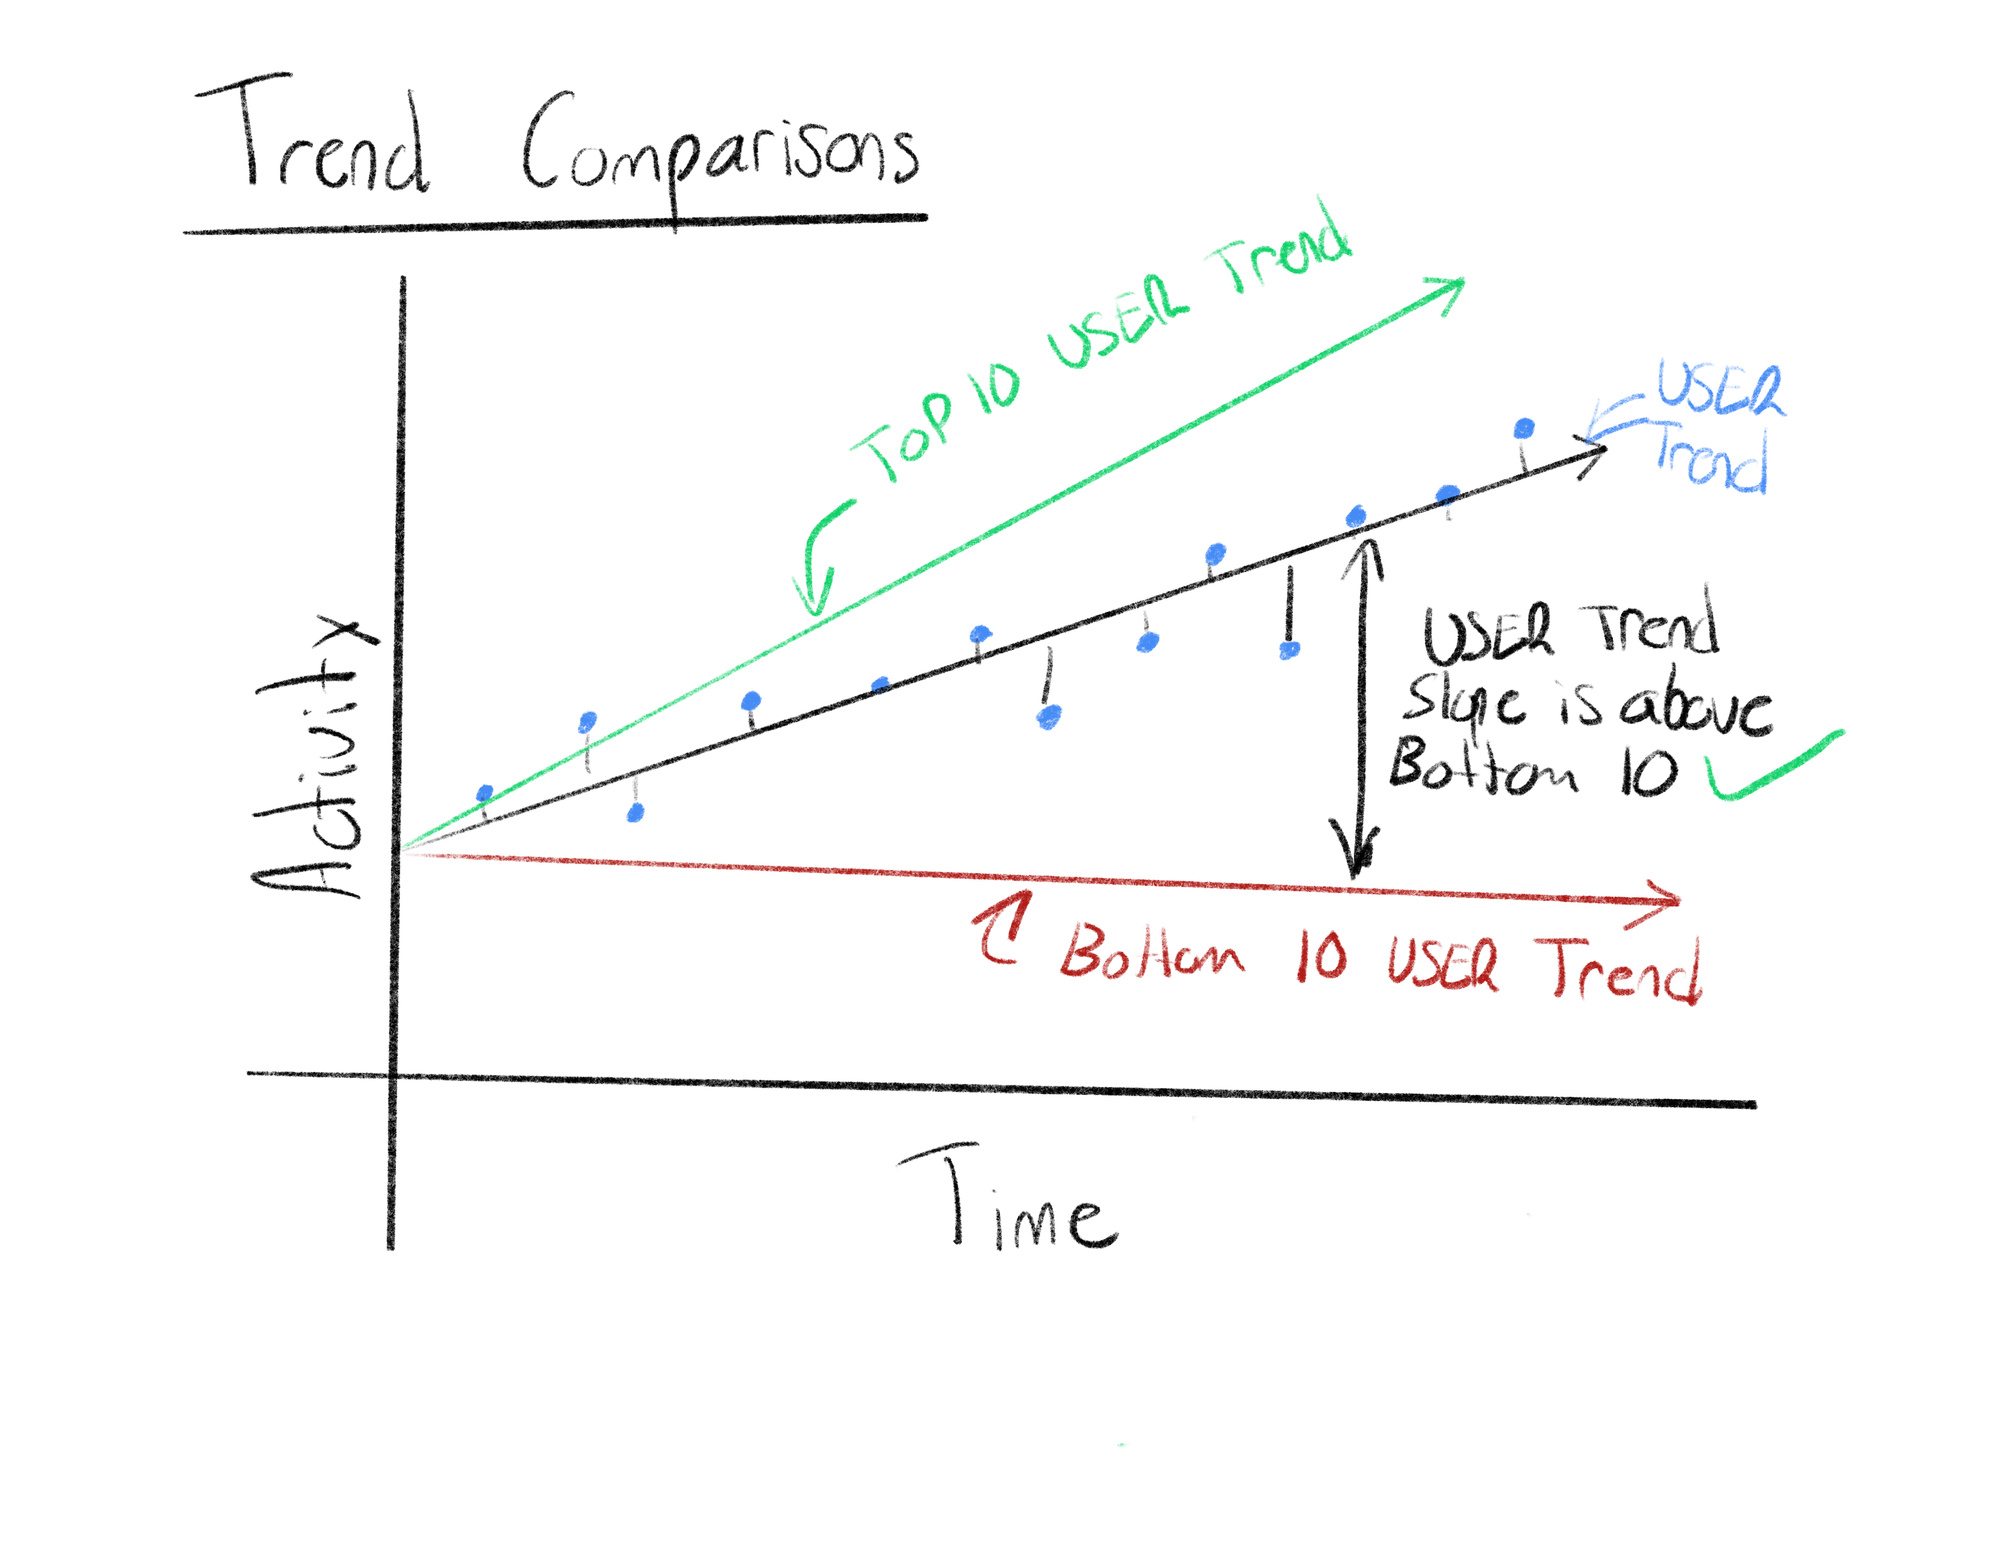
These insights allow product managers to view who and when they should take corrective action to boost engagement on their platform and potentially reduce churn events.